> ## Documentation Index
> Fetch the complete documentation index at: https://guide.recital.finance/llms.txt
> Use this file to discover all available pages before exploring further.
# Reconciliation Report
> Quickly create a new custom report
### Create a New Reconciliation Report
#### Prerequisites
* **Roles:** Owner, Admin, Reconciliation Officer, Treasury Officer, or Chargeback Officer (any role with "Reporting:Create").
* **Data Availability:** At least one completed **Run** (for reconciliation outcomes) or active data sources (Transactions, Balances).
Reports are generated from **normalized, reconciled, and versioned** datasets to ensure auditability.
#### Steps
Creating a custom reconciliation report is a straight forward, self-service process.
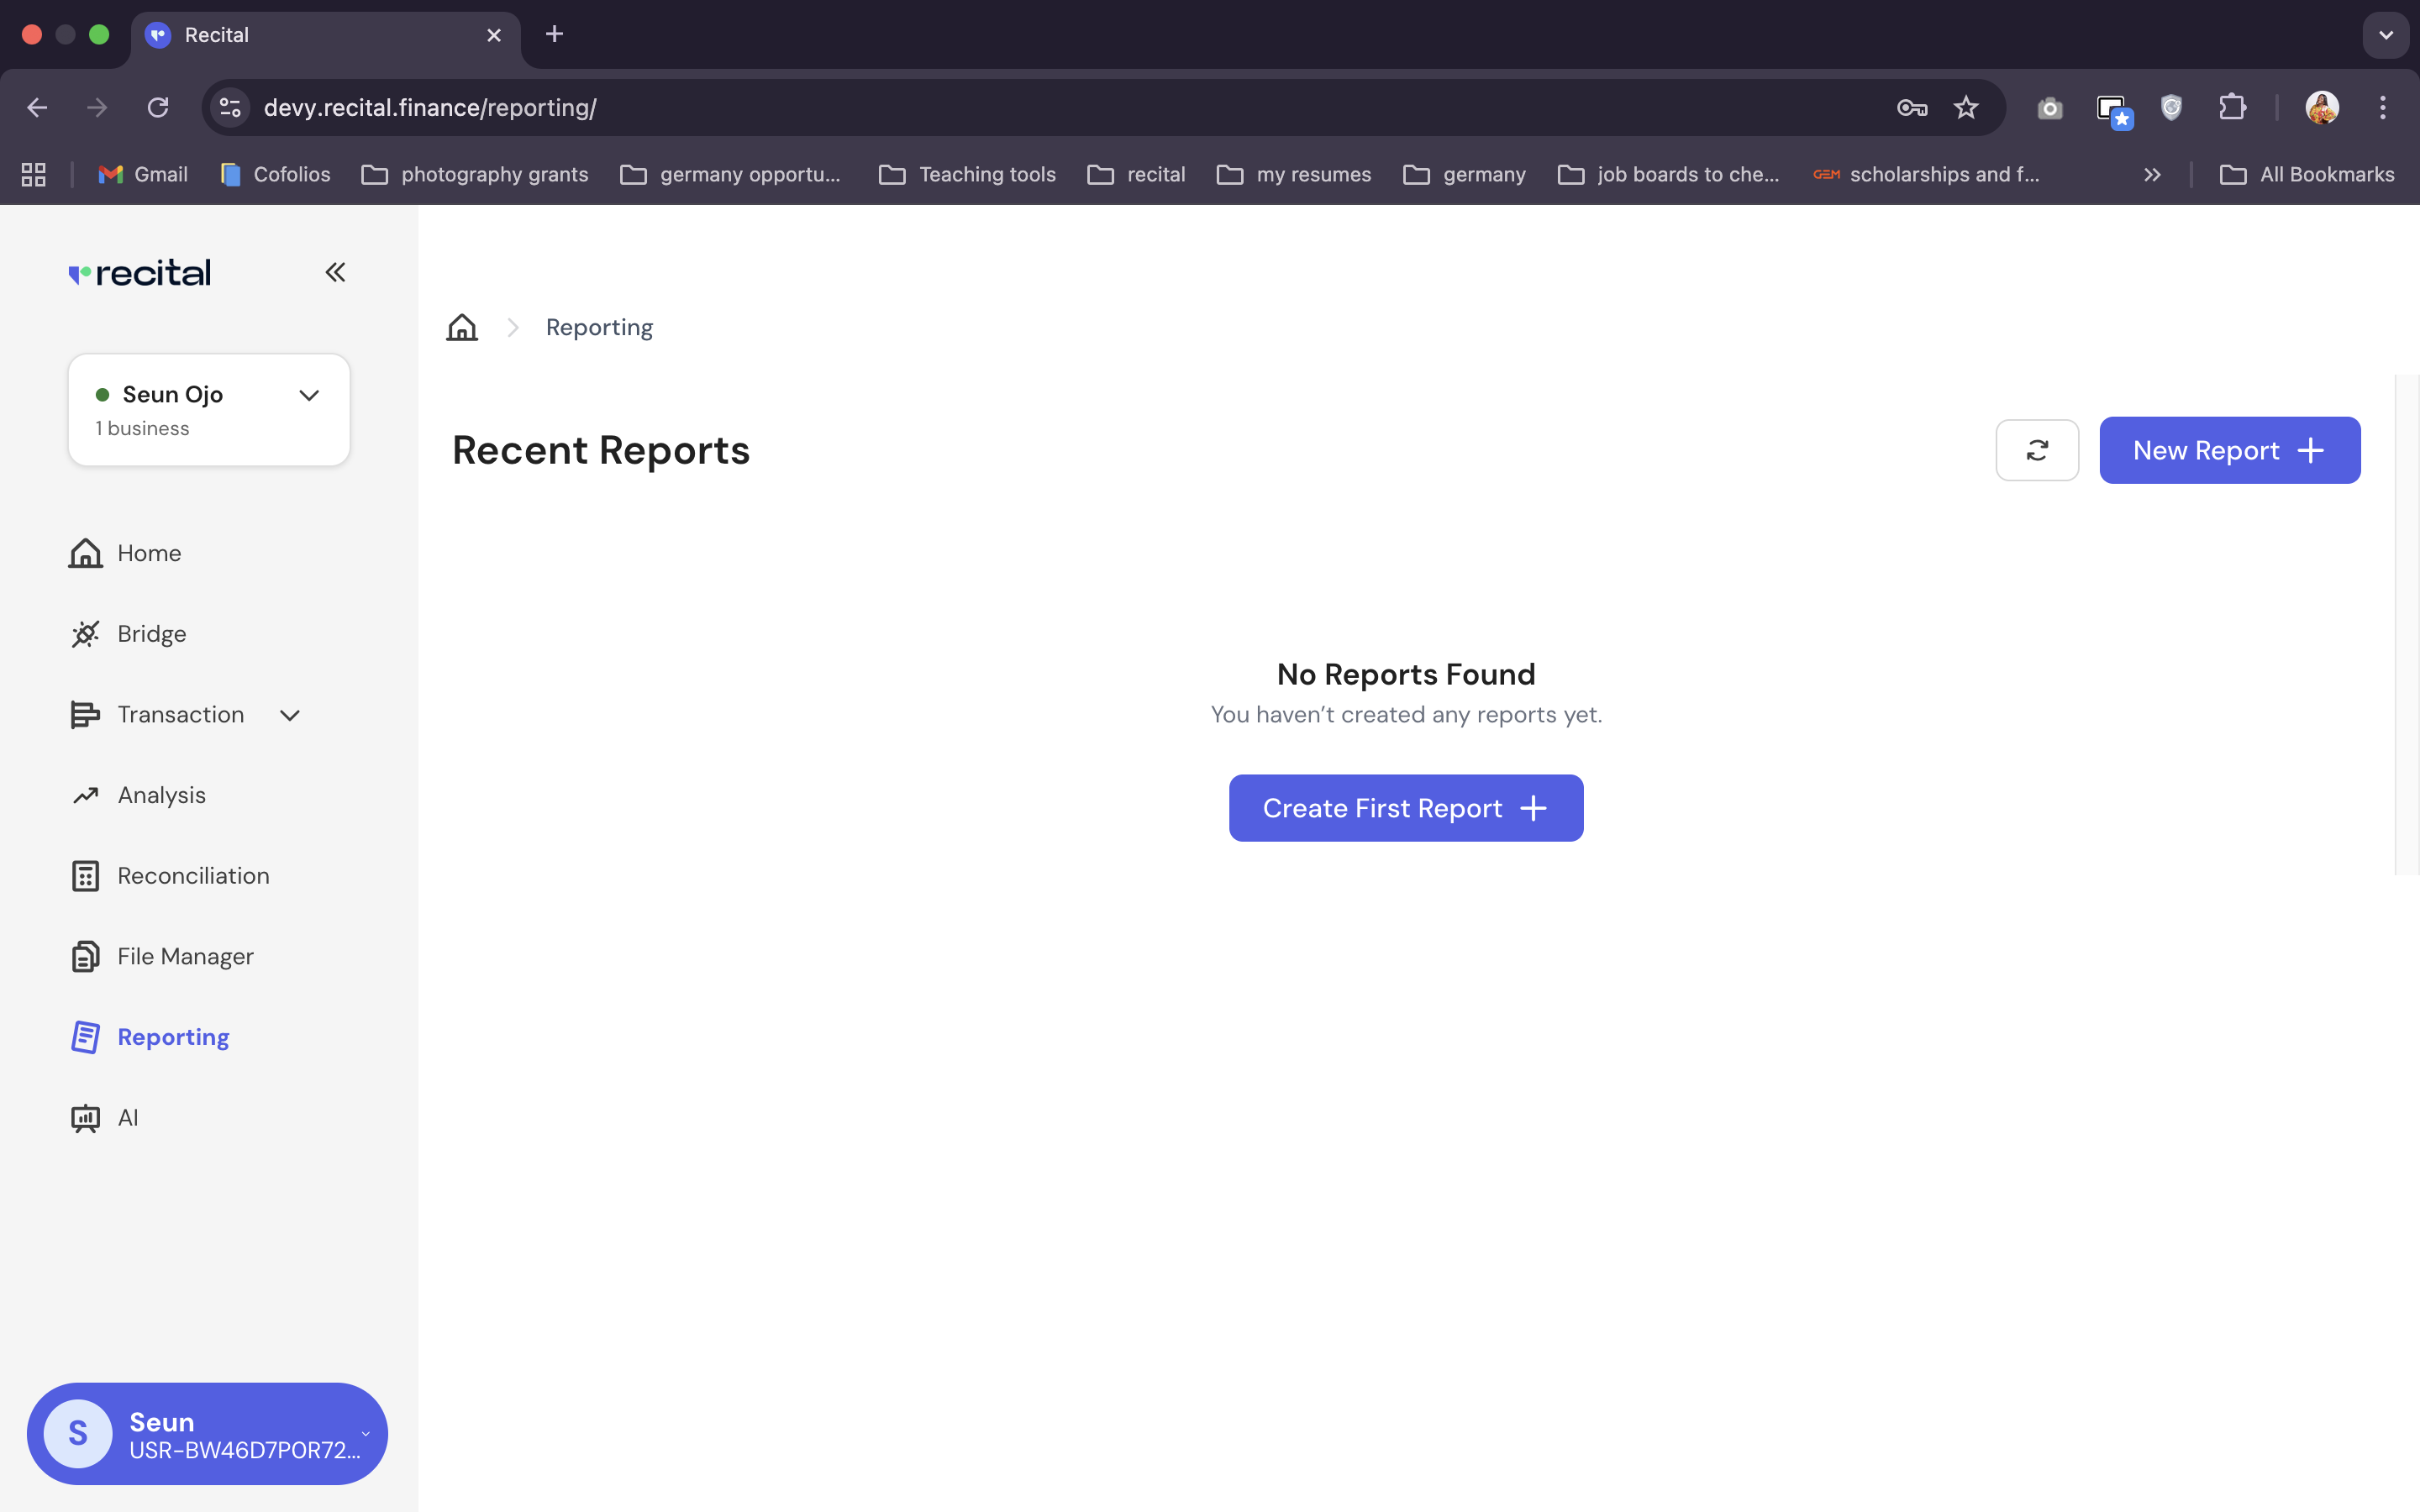
Navigate to Reporting using the left menu on the Recital platform. Then click on the "New Report" button.
Under the "Configure" section, enter the report name and description
Use the "Filter" section to precisely specify the dataset you need to power your custom report.
**Data Point**:
Most finance ops, start with **Reconciliation**. Other available data point may include balances, transaction, etc.
| Data Point | Description | Typical Fields |
| :------------- | :----------------------------------------------------------- | :--------------------------------------------------------------- |
| Reconciliation | Results from completed runs (matched, partial, unreconciled) | unique\_txn\_id, amount, match\_status, data |
| Transactions | Unified ledger across banks, PSPs, switches | txn\_id, type, amount, currency, provider, created\_at |
| Balances | Daily or intraday balances by institution/account | institution, account\_id, provider, balance, currency, txn\_date |
**Type**:
The available type depends on the selected **Data Point**. For **Reconciliation** data point, the available types are User Recon, Manual Recon, Automated Recon
**Available Types**
| Types | Description |
| :-------------- | :------------------------------------------------------------------------------------------------------------------------------------------ |
| User Recon | The reconciliation type where user uploads files, creates custom matching and transformation rules tailored to their reconciliation process |
| Manual Recon | The reconciliation type where you use a file on any file on any format, bank or provider data for reconciliation |
| Auto Recon | The reconciliation type where you schedule day and time intervals to connect your provider, bank or internal record and run reconciliation |
| Real-time Recon | Instantly match transactions across bank, provider, internal record, ERPs, payment gateways using accurate, up-to-date financial record |
**Date**:
For **Reconciliation** data point, this should be the date(s) of the reconciliation run. Select the same date for start and end date, if you want to only want reconciliation run outcome data within the same day. Select a date range for the start and end date, if you use the run outcome data for more than one day.
**Source**:
For Source, select the **reconciliation name** for the reconciliation you want to generate a custom report for.
**Runs**:
Choose the **reconciliation run** structured output data for your report
**Analysis Type**
Use Analysis type to select one or more files/data source in the selected *reconciliation runs* for your report
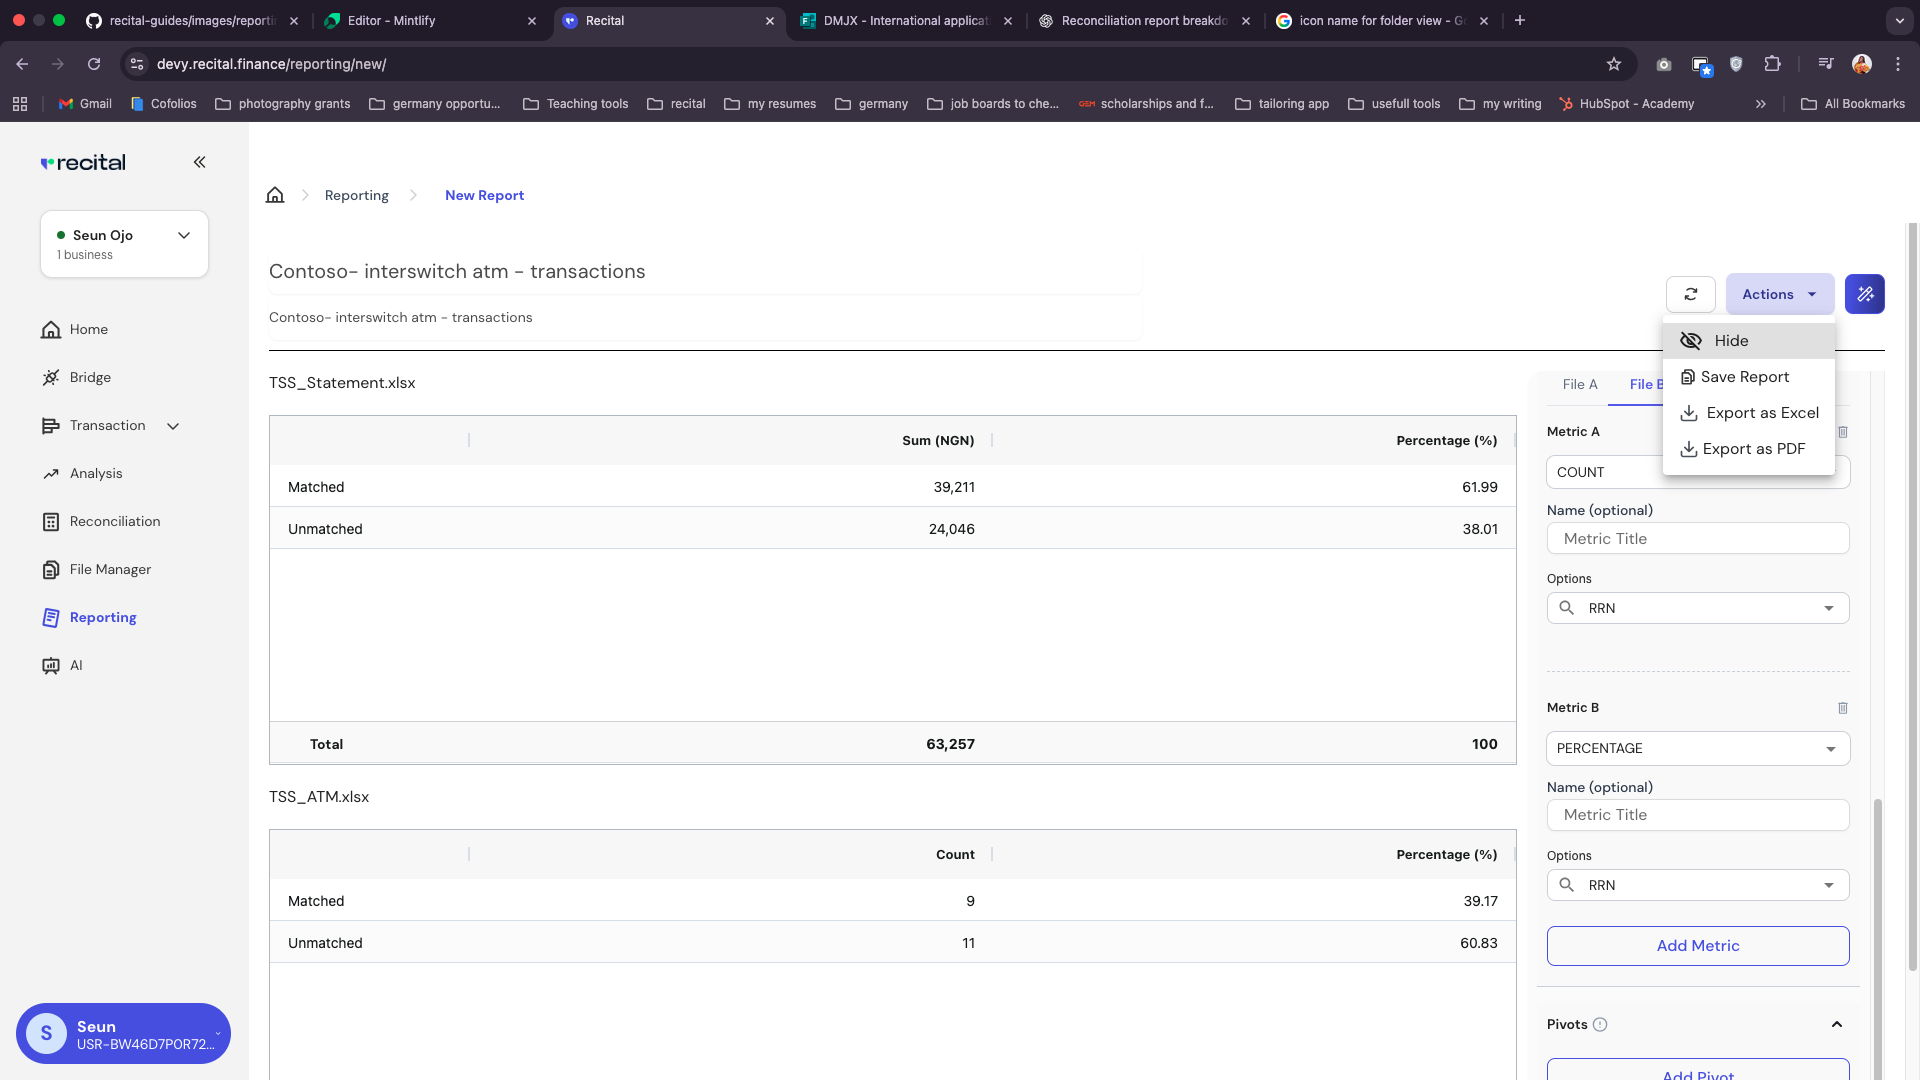 Use the **Metrics** section to configure the specific values you want to see in your report.
To add a Metric, simply the following:
1. Ensure you have filled the configure and filter sections of the report
2. Within the Metric section, click the "Add Metric" button
3. Use the first drop down field to choose a metric logic, e.g., SUM, COUNT, Percentage or Expression
4. Optionally, select a name for the metric to override the defaults
5. Use the options field to select a data column to apply the select metric logic on
You can add as many metrics as possible. To add more metrics, simply do the following:
1. Keep clicking on "Add Metric" to add more metrics
2. Enter the metric logic, optional metric name and data column to apply the metric logic on
To remove a Metric, simply click on the delete icon beside the Metric.
Also you can generate only one report or a separate report per selected file in the "Analysis Field". To generate separate report per file, do the following:
1. Ensure you have filled the configure, filter and metric sections of the report
2. Check the "Compare" option, under the Metrics section,
3. Use the File tab to specify the exact metrics you want to generate for each file for better comparison.
Use the **Metrics** section to configure the specific values you want to see in your report.
To add a Metric, simply the following:
1. Ensure you have filled the configure and filter sections of the report
2. Within the Metric section, click the "Add Metric" button
3. Use the first drop down field to choose a metric logic, e.g., SUM, COUNT, Percentage or Expression
4. Optionally, select a name for the metric to override the defaults
5. Use the options field to select a data column to apply the select metric logic on
You can add as many metrics as possible. To add more metrics, simply do the following:
1. Keep clicking on "Add Metric" to add more metrics
2. Enter the metric logic, optional metric name and data column to apply the metric logic on
To remove a Metric, simply click on the delete icon beside the Metric.
Also you can generate only one report or a separate report per selected file in the "Analysis Field". To generate separate report per file, do the following:
1. Ensure you have filled the configure, filter and metric sections of the report
2. Check the "Compare" option, under the Metrics section,
3. Use the File tab to specify the exact metrics you want to generate for each file for better comparison.
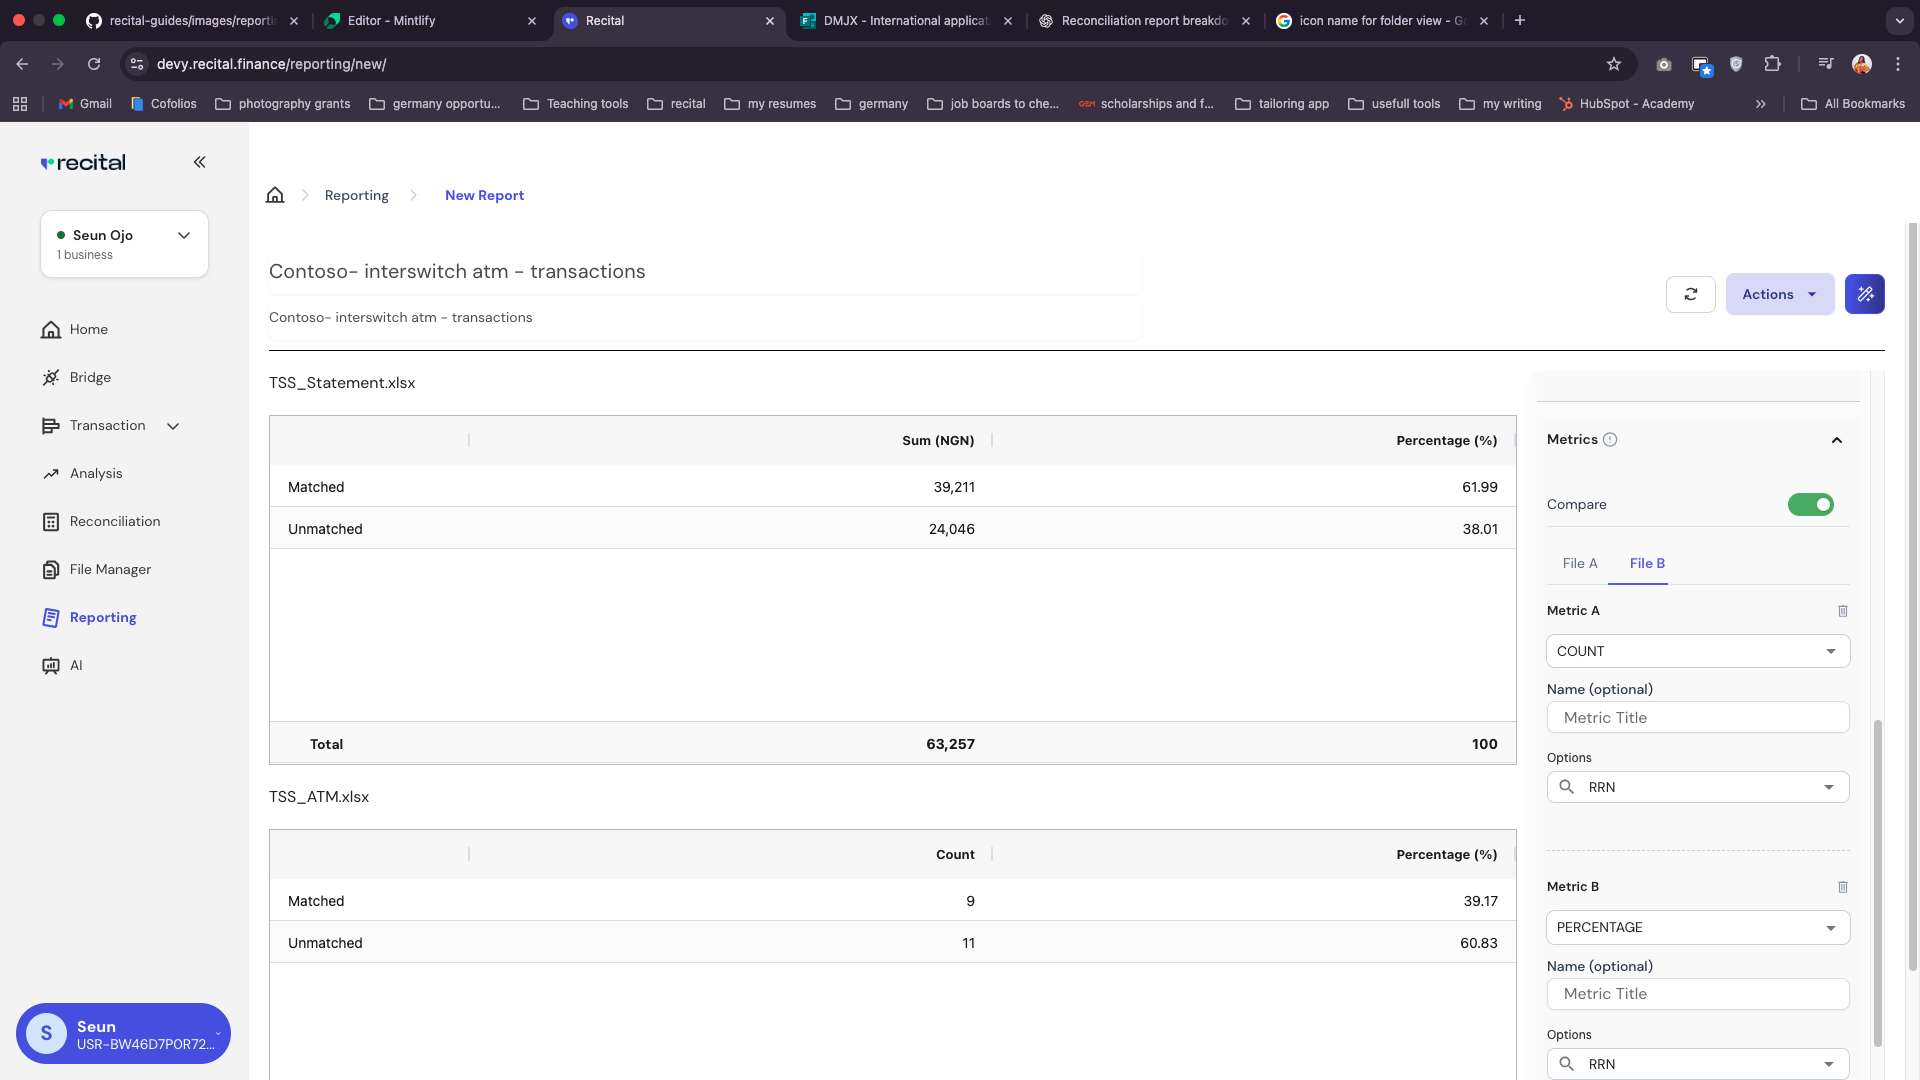 **Supported Metric Logic**
| Logic | Description | Example |
| :--------- | :-------------------------------------------------------------------------------------------------------------------------- | :------------------------------------------------------ |
| Sum | Returns the sum of the data column selected with the **options** field | Sum(txn\_amount) |
| Count | Returns the count of the data column selected with the **options** field | Count(unique\_txn\_ID) |
| Average | Returns the average of the data column selected with the **options** field | Average(txn\_amount) |
| Expression | Returns the result of apply an expression, e.g., addition, subtraction or multiplication in an expression with data columns | txn\_amount **minus expression** fees, returns net fees |
**Common Data Columns for Reconciliation**
| Dimension | Description |
| :-------------- | :-------------------------------- |
| Unique\_txn\_Id | RRN |
| Account | Bank Account # or wallet ID |
| Currency | NGN, USD, etc. |
| Status | Reconciled, Partial, Unreconciled |
| Date | Day, Week, Month, Time |
Use the **Pivot** section to configure rows for crosstab/grouping views.
To add a pivot,simply do the following:
1. Under the Pivot section, click the "Add Pivot" button
2. Specify the the column/field you want to use to slice/group the report
To add more Pivots, simply repeat the step above.
To remove a Pivot, simply click on the delete icon beside the Pivot.
**Supported Metric Logic**
| Logic | Description | Example |
| :--------- | :-------------------------------------------------------------------------------------------------------------------------- | :------------------------------------------------------ |
| Sum | Returns the sum of the data column selected with the **options** field | Sum(txn\_amount) |
| Count | Returns the count of the data column selected with the **options** field | Count(unique\_txn\_ID) |
| Average | Returns the average of the data column selected with the **options** field | Average(txn\_amount) |
| Expression | Returns the result of apply an expression, e.g., addition, subtraction or multiplication in an expression with data columns | txn\_amount **minus expression** fees, returns net fees |
**Common Data Columns for Reconciliation**
| Dimension | Description |
| :-------------- | :-------------------------------- |
| Unique\_txn\_Id | RRN |
| Account | Bank Account # or wallet ID |
| Currency | NGN, USD, etc. |
| Status | Reconciled, Partial, Unreconciled |
| Date | Day, Week, Month, Time |
Use the **Pivot** section to configure rows for crosstab/grouping views.
To add a pivot,simply do the following:
1. Under the Pivot section, click the "Add Pivot" button
2. Specify the the column/field you want to use to slice/group the report
To add more Pivots, simply repeat the step above.
To remove a Pivot, simply click on the delete icon beside the Pivot.
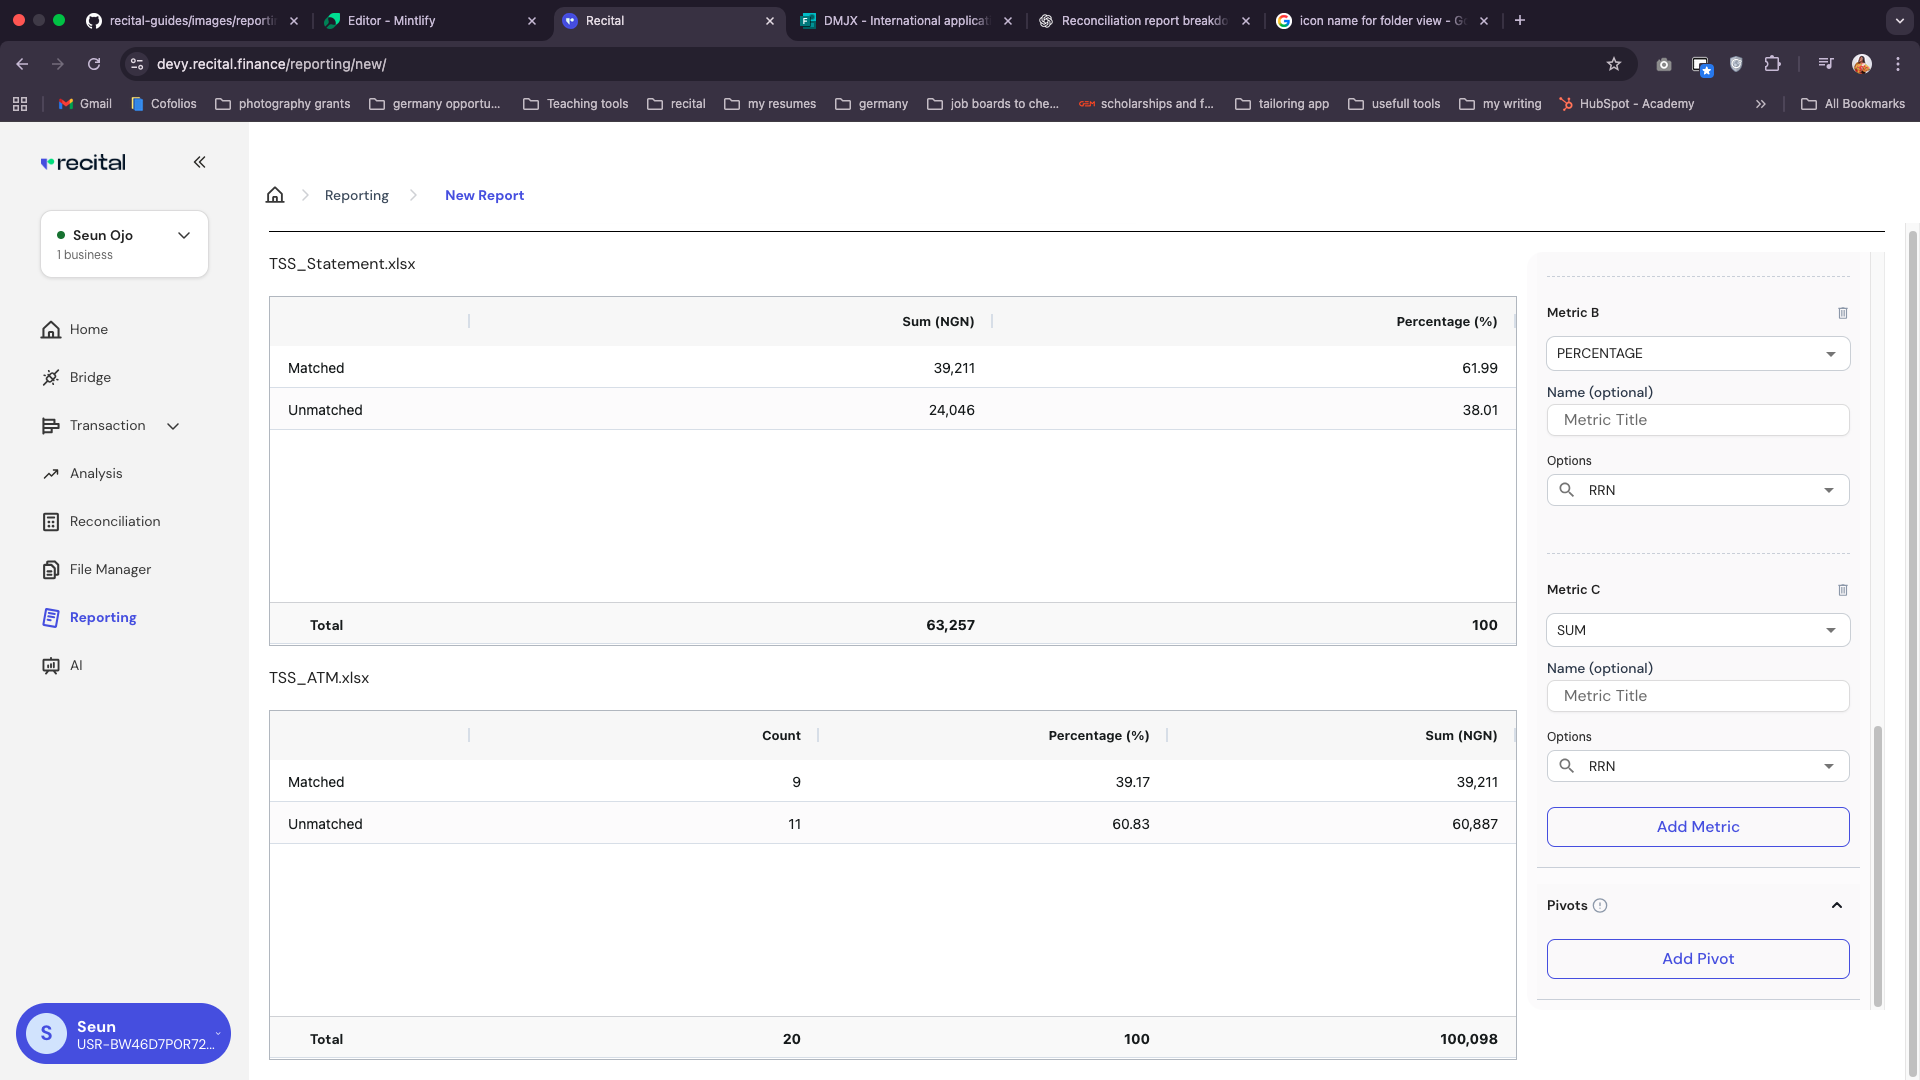 Reports render automatically on view section as you add in the metrics and pivots.
Validate totals against known checkpoints (e.g., daily GL totals, prior day balance). Fix filters or metrics or pivots if results look unexpected.
To export the data, simply click on the Download button, and choose the export format: Excel, PDF.
Reports render automatically on view section as you add in the metrics and pivots.
Validate totals against known checkpoints (e.g., daily GL totals, prior day balance). Fix filters or metrics or pivots if results look unexpected.
To export the data, simply click on the Download button, and choose the export format: Excel, PDF.
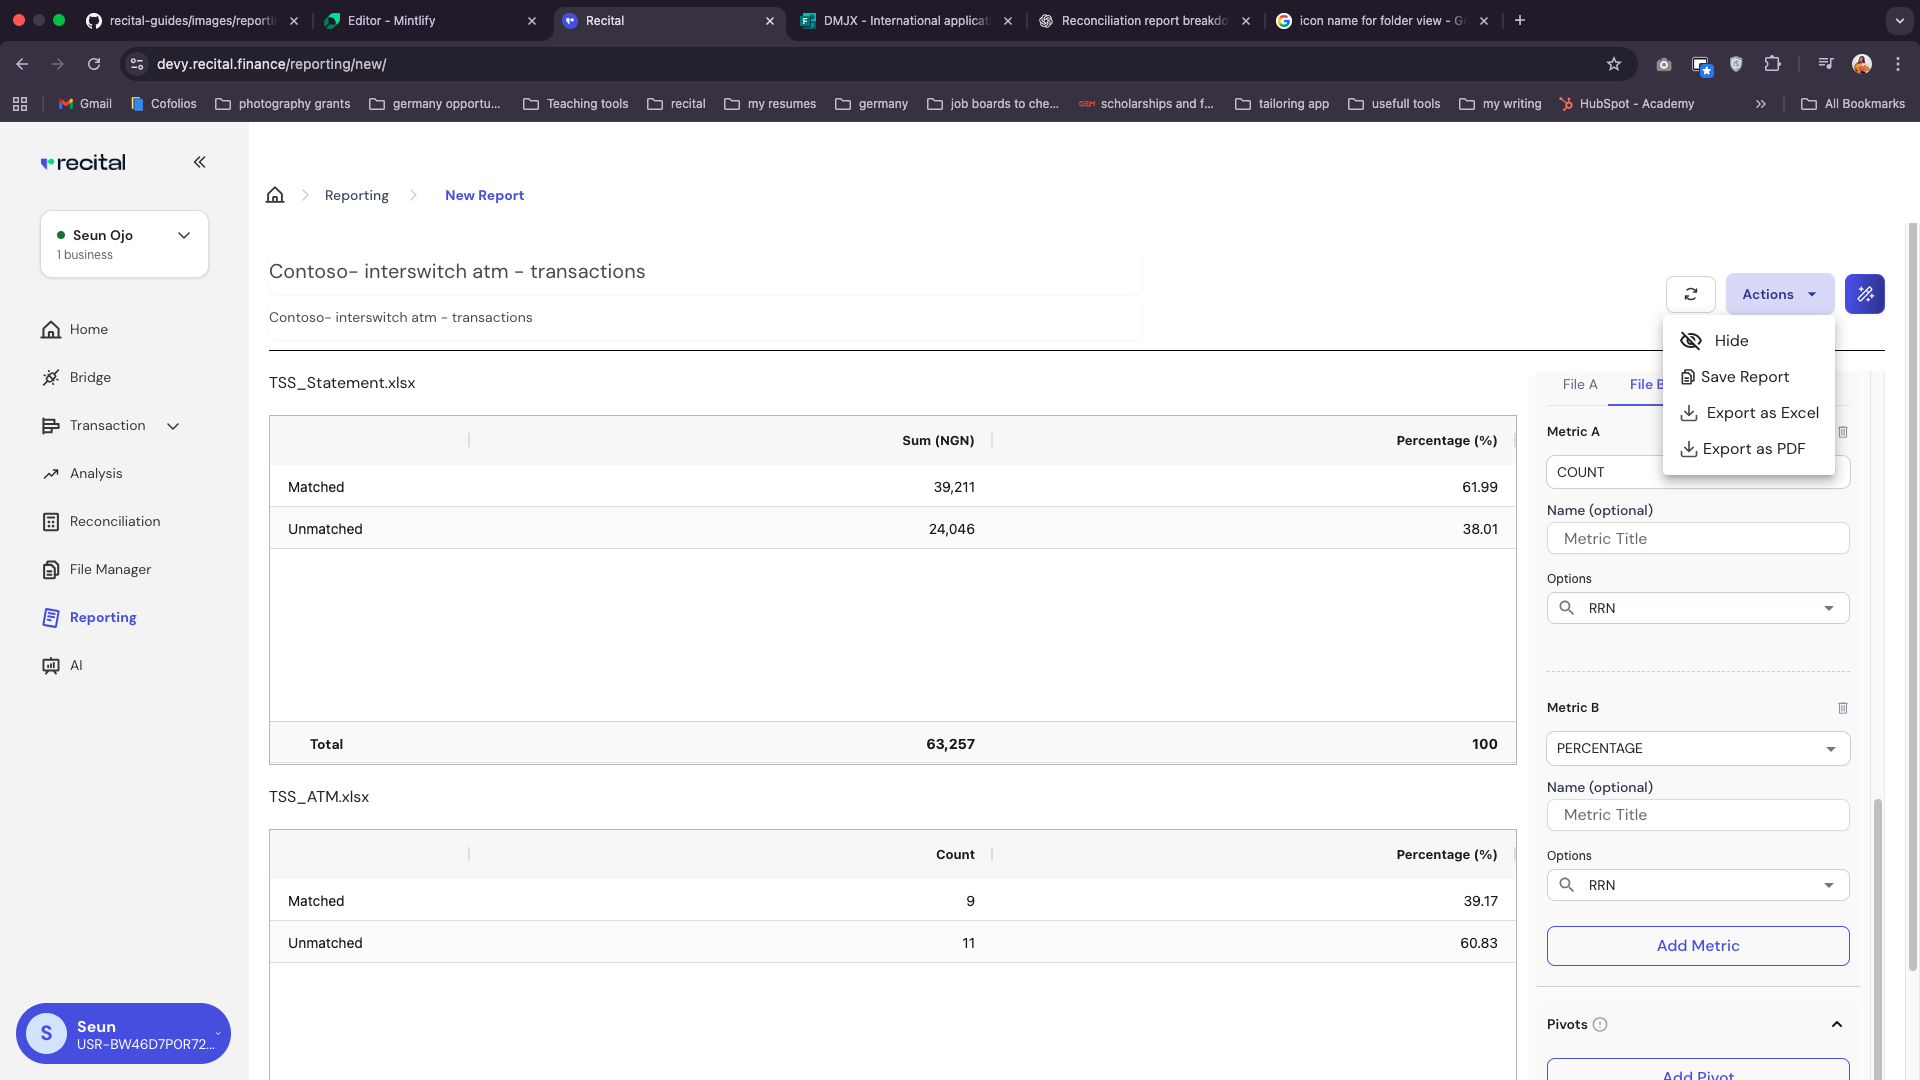 Save Reports for later use.
Saved reports appear on the Reporting home page, where they can be assessed and spooled again or edited.
Save Reports for later use.
Saved reports appear on the Reporting home page, where they can be assessed and spooled again or edited.
 ***
#### Sample Custom Reconciliation Report Output
File A
| | Sum(NGN) | Count | Percentage(%) |
| :--------- | -------: | ----: | ------------: |
| Matched | 91,400 | 9 | 61.99% |
| Un-matched | 55,795 | 7 | 38.015% |
File B
| | Sum(NGN) | Count | Percentage(%) |
| :--------- | -------: | ----: | ------------: |
| Matched | 91,400 | 9 | 39.17% |
| Un-matched | 110,886 | 11 | 60.83% |
***
#### Best Practices
* **Name Reports clearly:** Make reports easy to search and classify.
* **Lock Filters:** Avoid accidental scope drift for recurring reports.
* **Version Awareness:** Tie each report to a **Runs Version** when using reconciliation outcomes.
* **Validate Totals:** Reconcile totals with GL or prior-day check figures.
* **Limit recipients:** Reduce noise—send only to people who need it.
Use the same **filters, metrics and pivots** across scheduled reports to maintain comparability over time.
***
#### Troubleshooting
| Issue | Likely cause | Fix |
| :----------------------- | :--------------------------------------- | :-------------------------------------------------- |
| Empty results | Filters exclude all data; date range off | Widen date range; clear conflicting filters |
| Totals don't match GL | Different time zone or posting window | Align to posting calendar; set consistent time zone |
| High exceptions suddenly | New ruleset version applied | Check **ruleset\_version**; compare with prior run |
| Slow preview | Very large date range or many dimensions | Narrow range; reduce pivot complexity |
***
#### Sample Custom Reconciliation Report Output
File A
| | Sum(NGN) | Count | Percentage(%) |
| :--------- | -------: | ----: | ------------: |
| Matched | 91,400 | 9 | 61.99% |
| Un-matched | 55,795 | 7 | 38.015% |
File B
| | Sum(NGN) | Count | Percentage(%) |
| :--------- | -------: | ----: | ------------: |
| Matched | 91,400 | 9 | 39.17% |
| Un-matched | 110,886 | 11 | 60.83% |
***
#### Best Practices
* **Name Reports clearly:** Make reports easy to search and classify.
* **Lock Filters:** Avoid accidental scope drift for recurring reports.
* **Version Awareness:** Tie each report to a **Runs Version** when using reconciliation outcomes.
* **Validate Totals:** Reconcile totals with GL or prior-day check figures.
* **Limit recipients:** Reduce noise—send only to people who need it.
Use the same **filters, metrics and pivots** across scheduled reports to maintain comparability over time.
***
#### Troubleshooting
| Issue | Likely cause | Fix |
| :----------------------- | :--------------------------------------- | :-------------------------------------------------- |
| Empty results | Filters exclude all data; date range off | Widen date range; clear conflicting filters |
| Totals don't match GL | Different time zone or posting window | Align to posting calendar; set consistent time zone |
| High exceptions suddenly | New ruleset version applied | Check **ruleset\_version**; compare with prior run |
| Slow preview | Very large date range or many dimensions | Narrow range; reduce pivot complexity |